Homes for sale in 767 - N. Welland, Welland
123 active MLS® listings in 767 - N. Welland. Updated daily from the live feed.
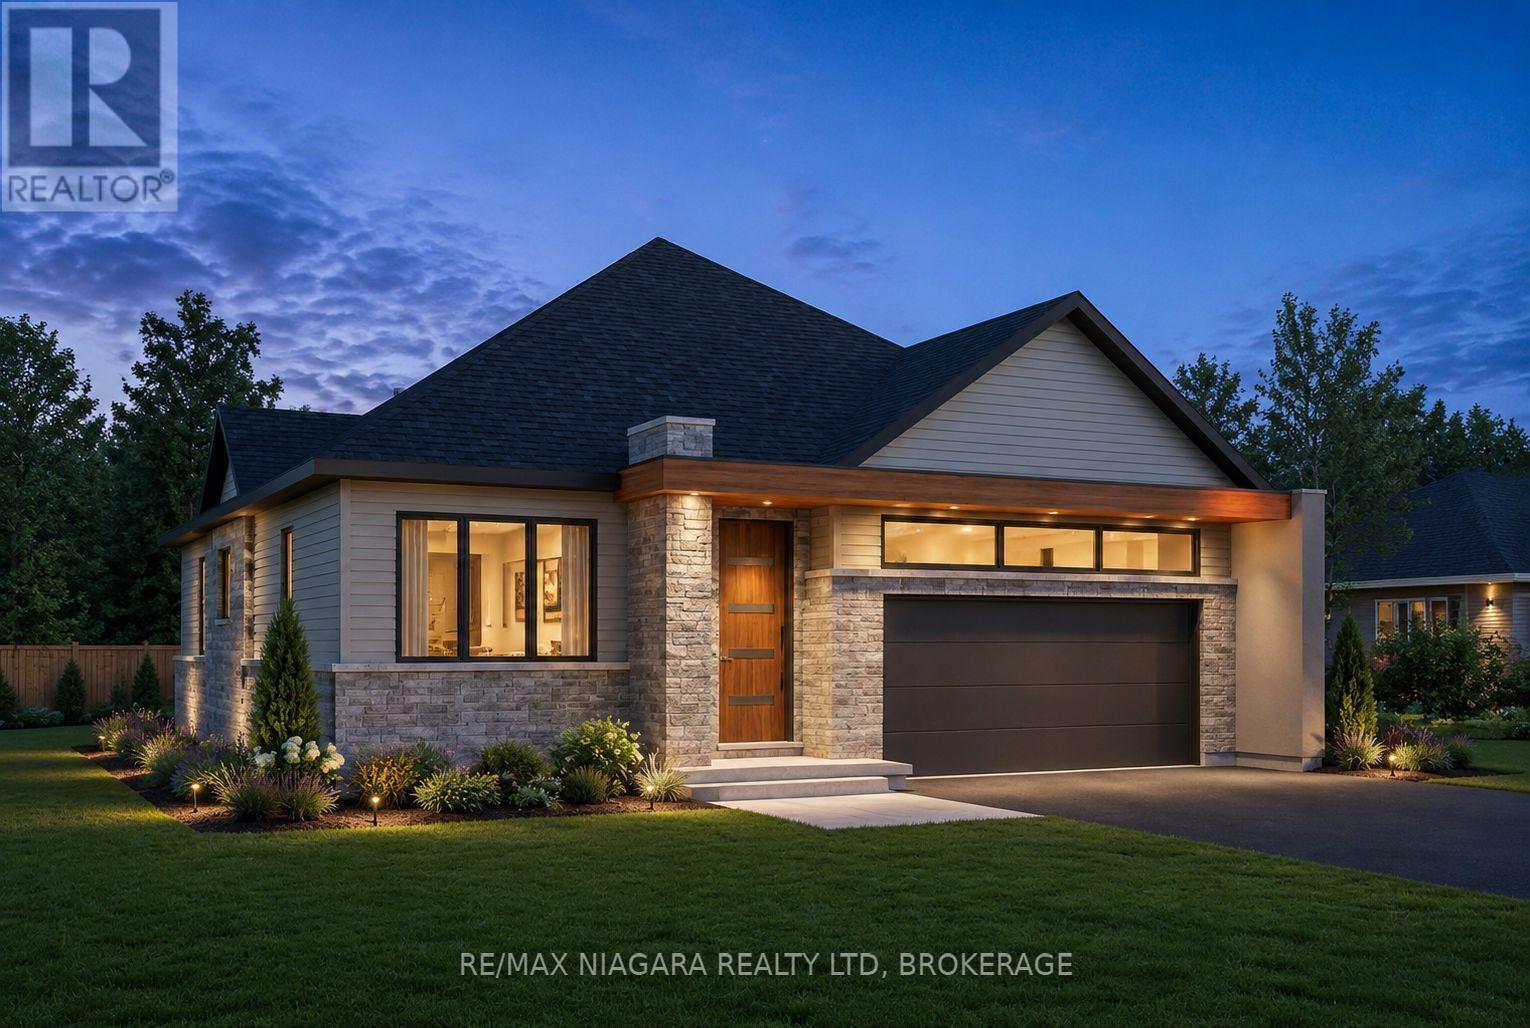 For Sale50 days3
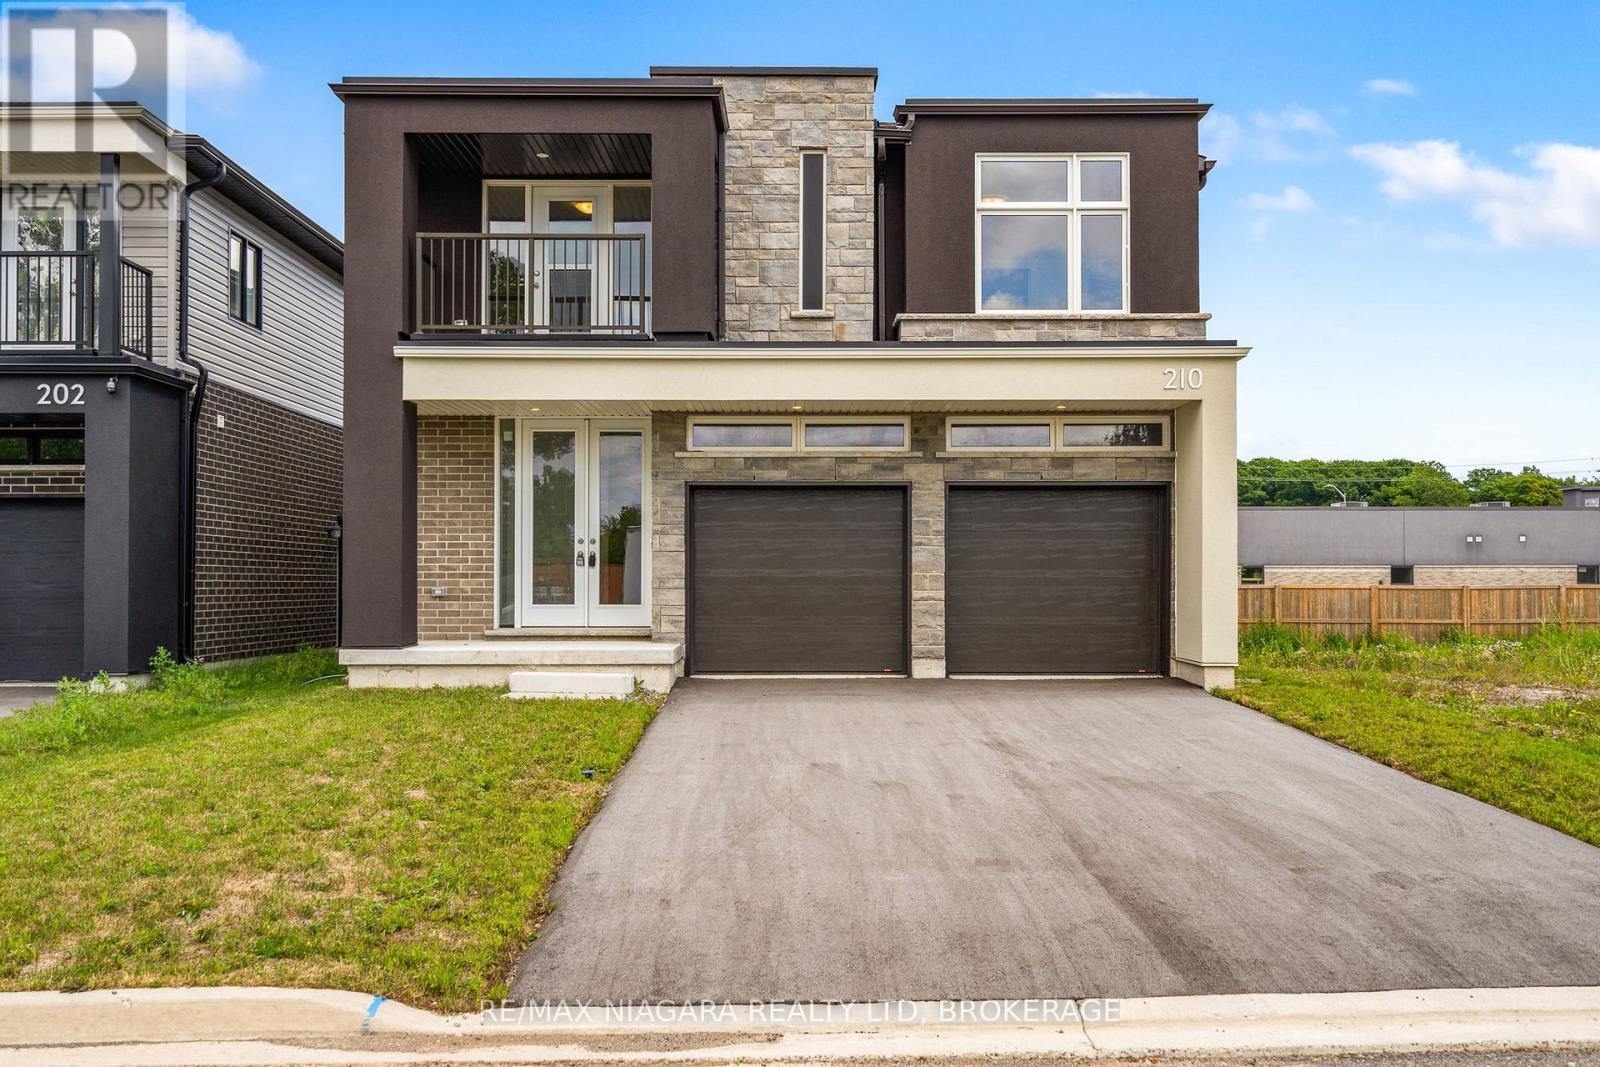 For Sale50 days27
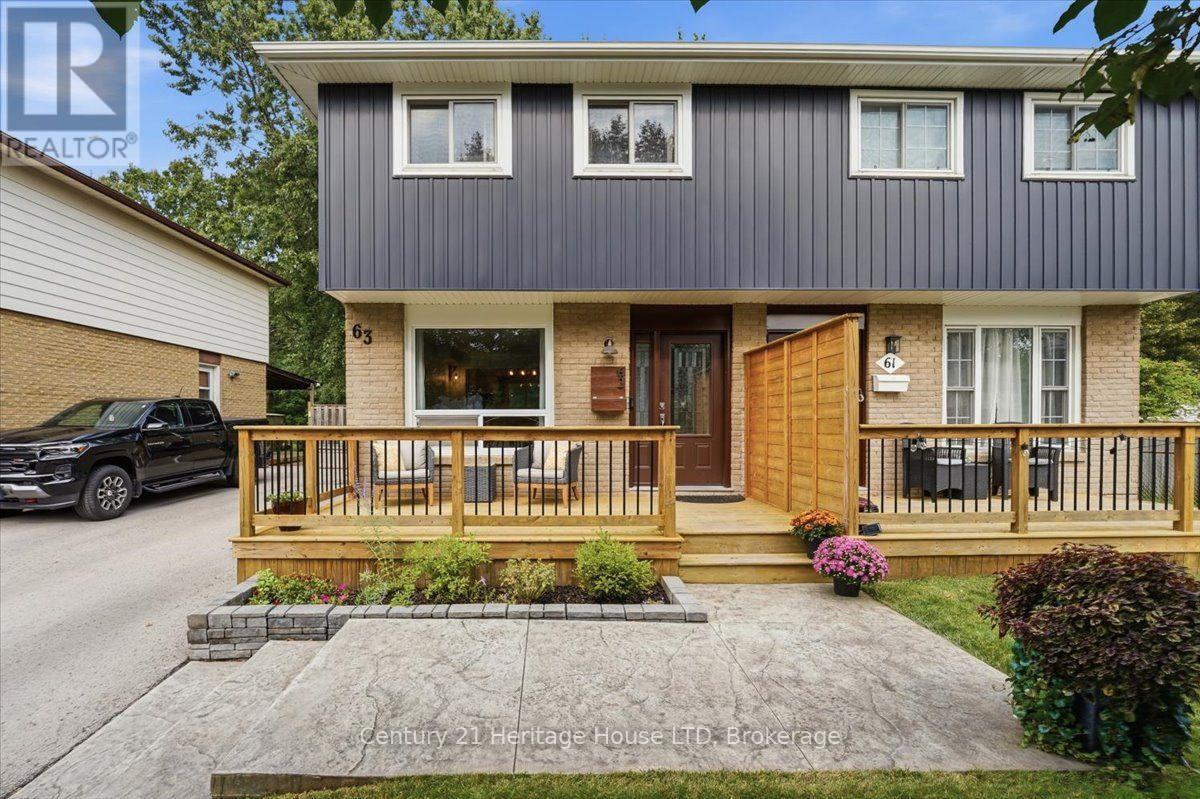 For Sale50 days50
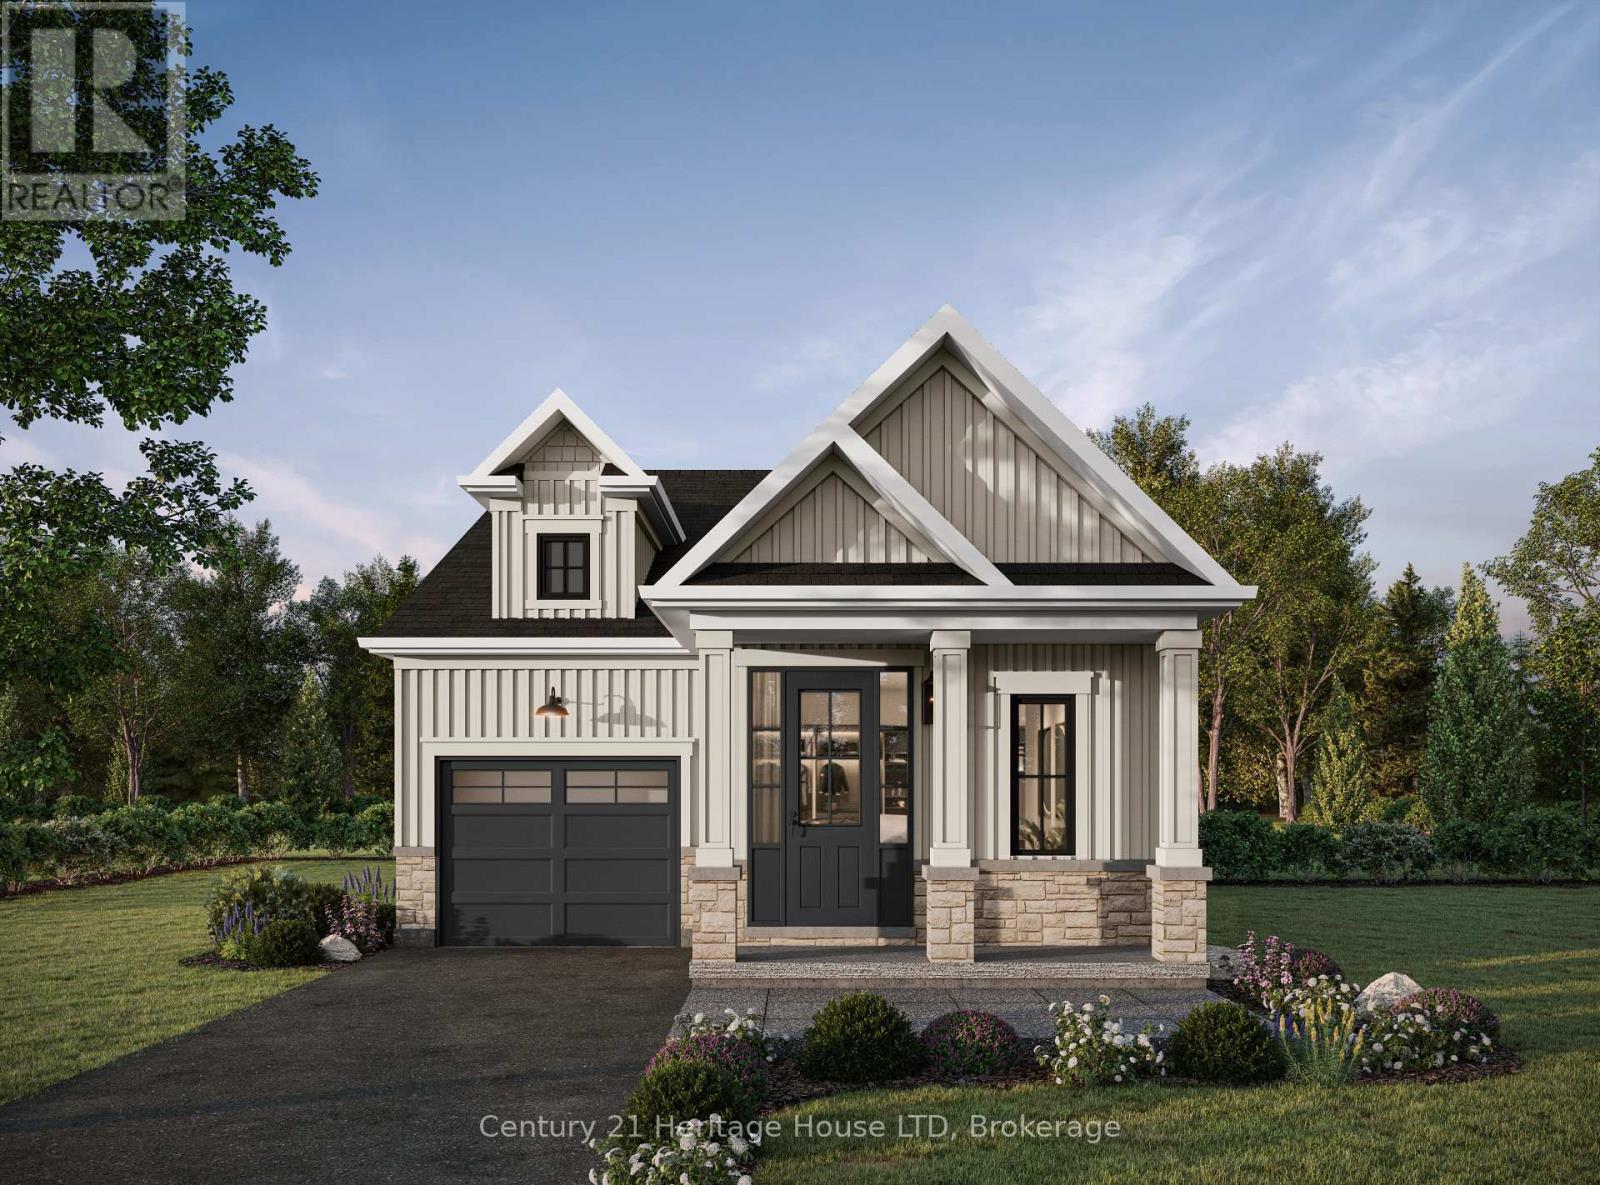 For Sale50 days5
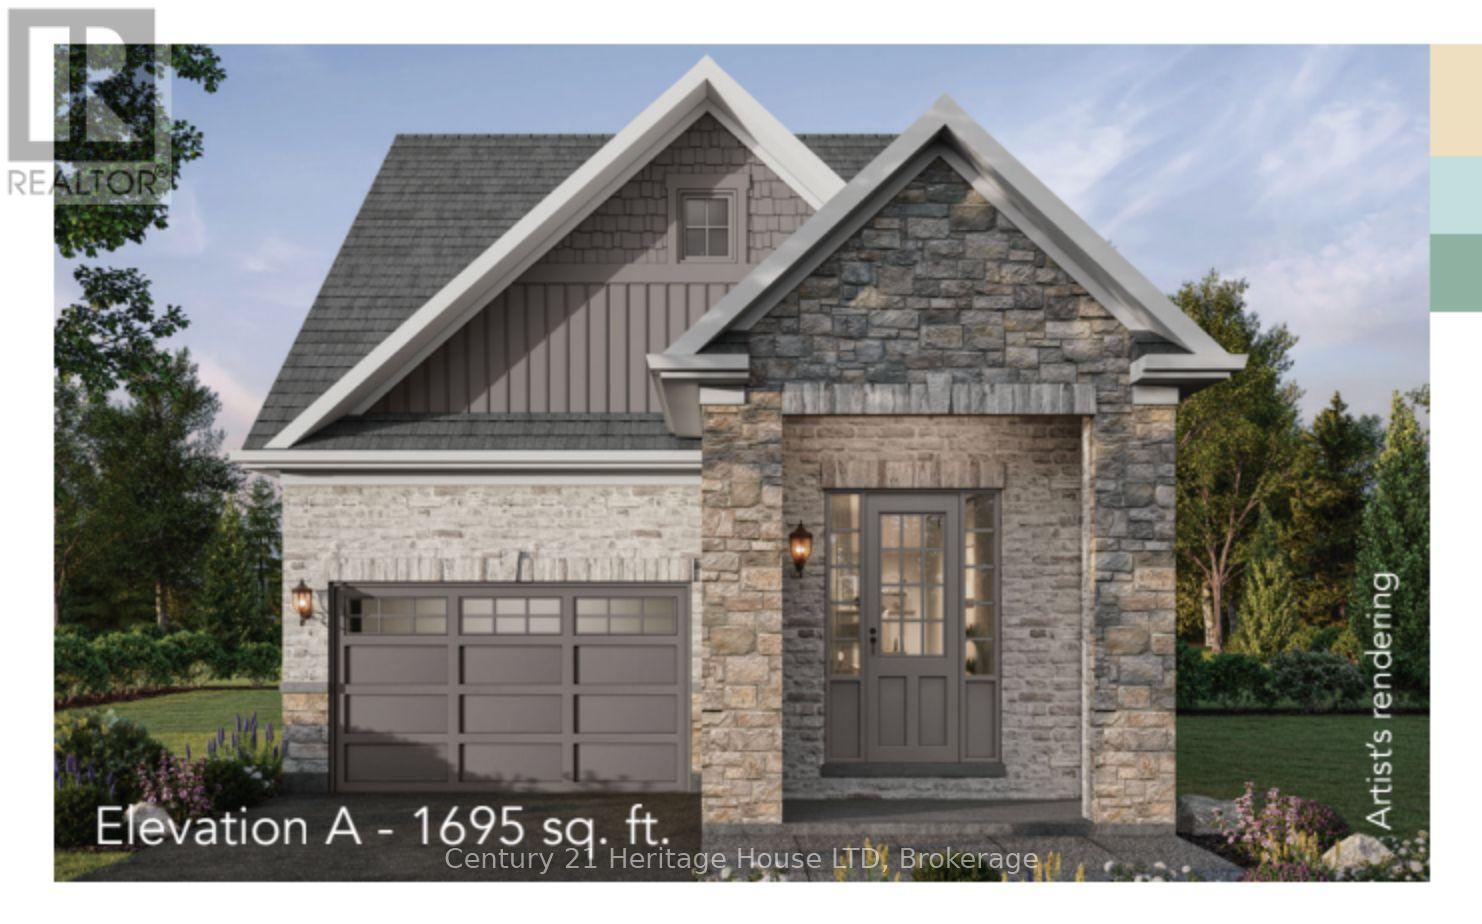 For Sale50 days14
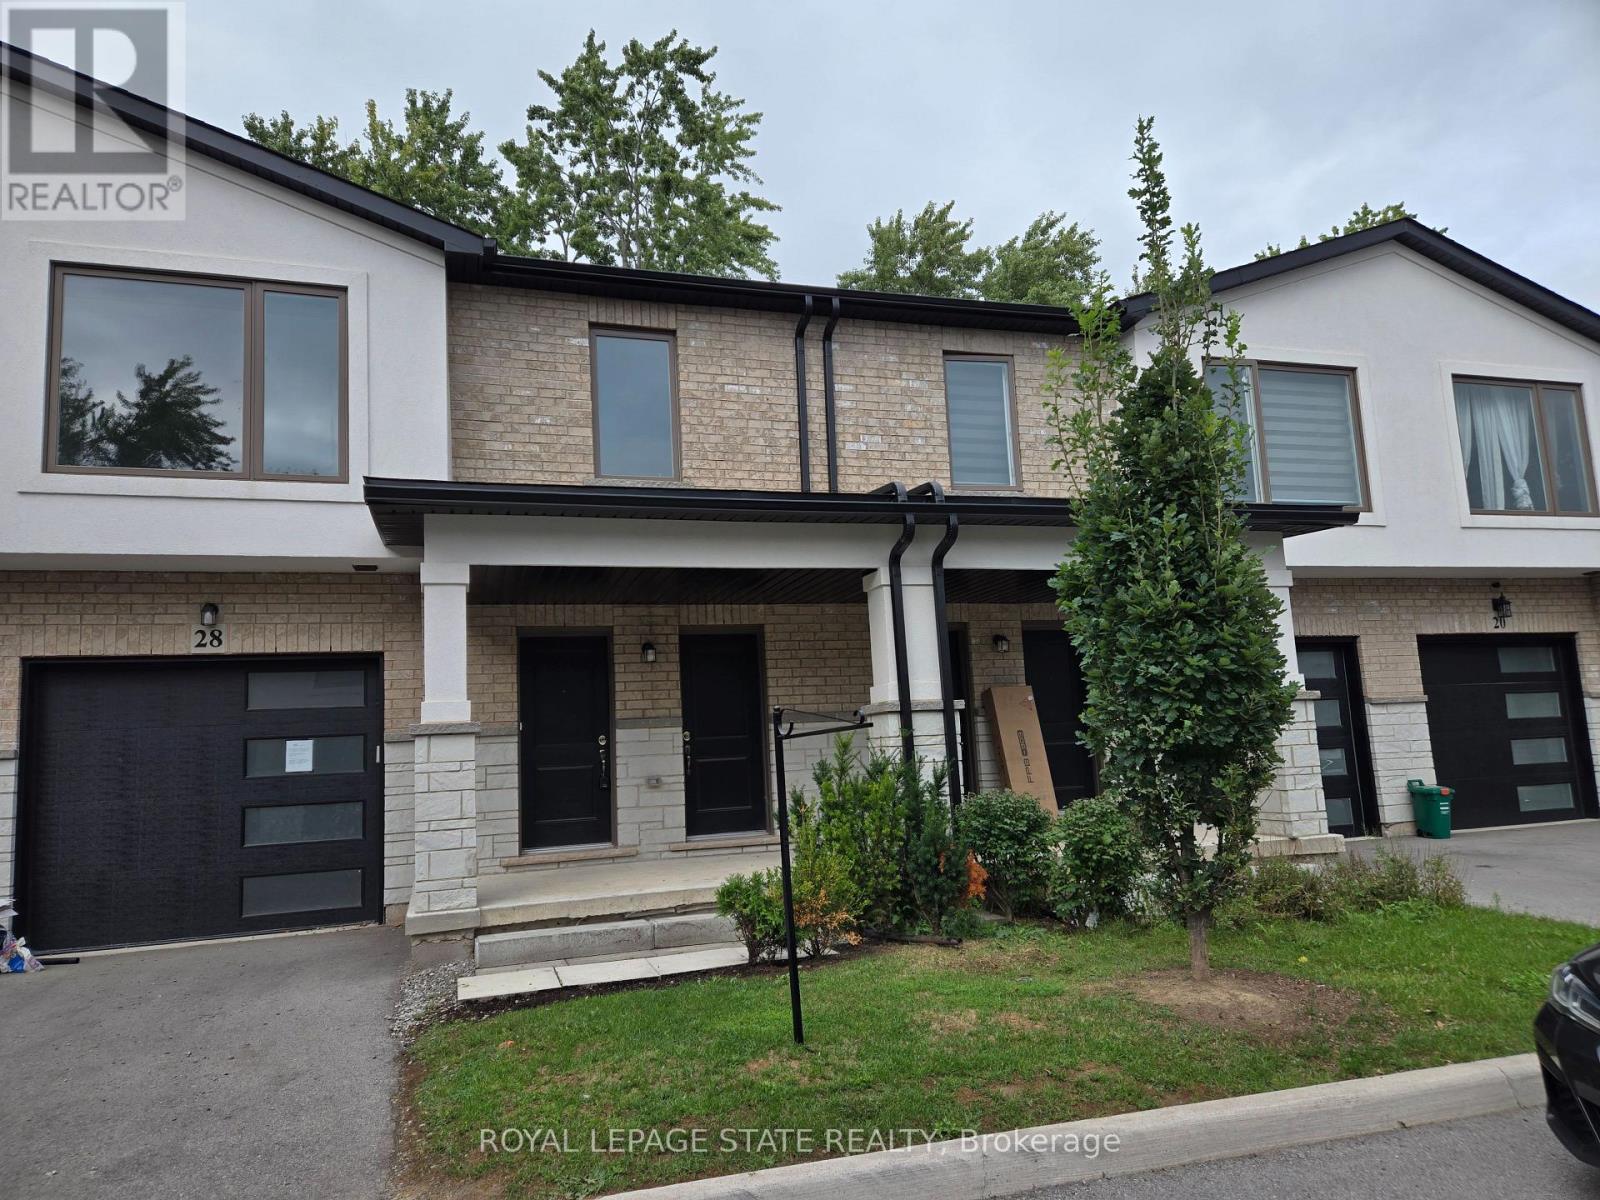 For Sale51 days16
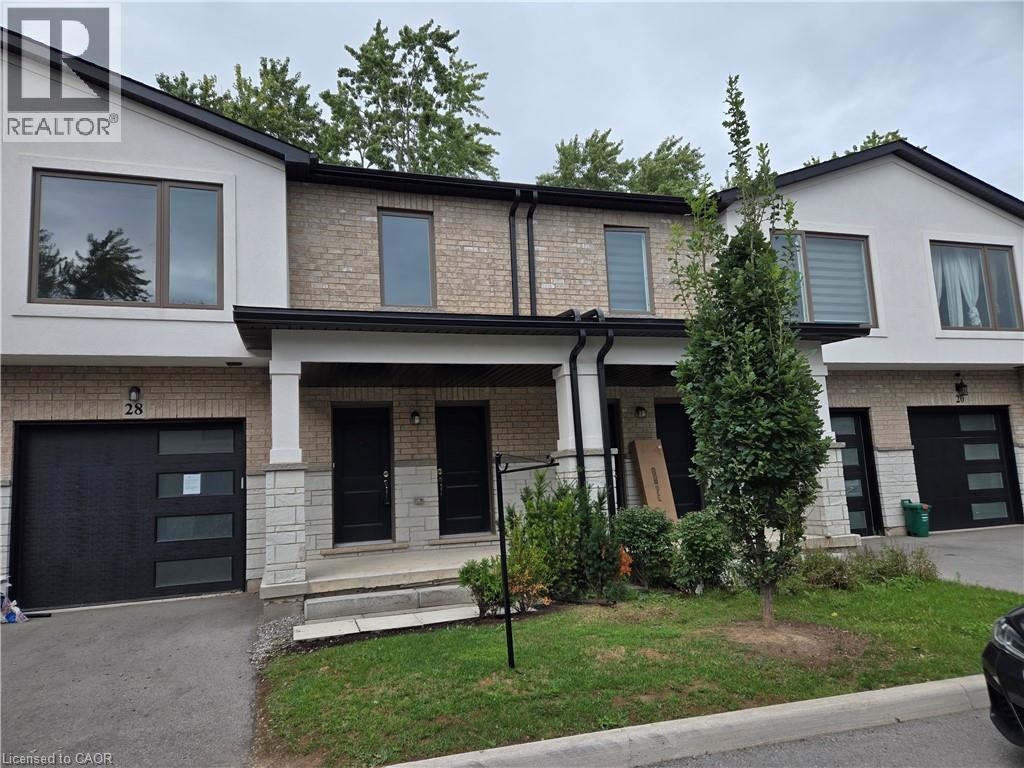 For Sale51 days16
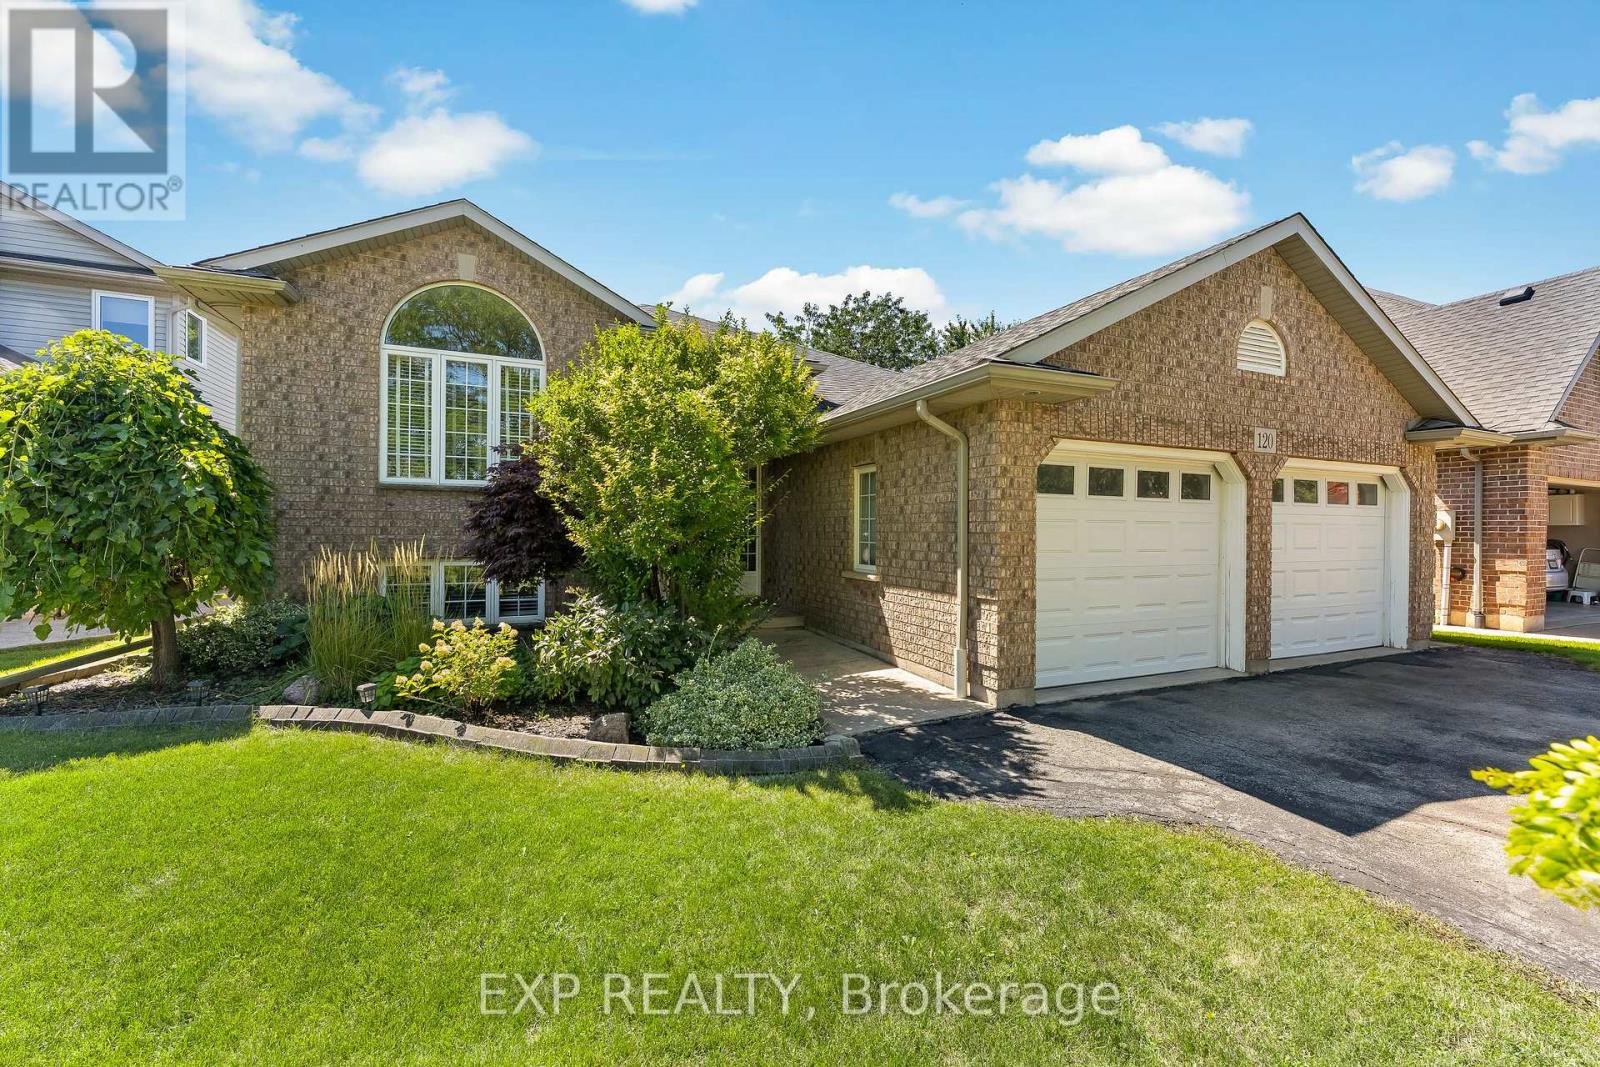 For Sale54 days32
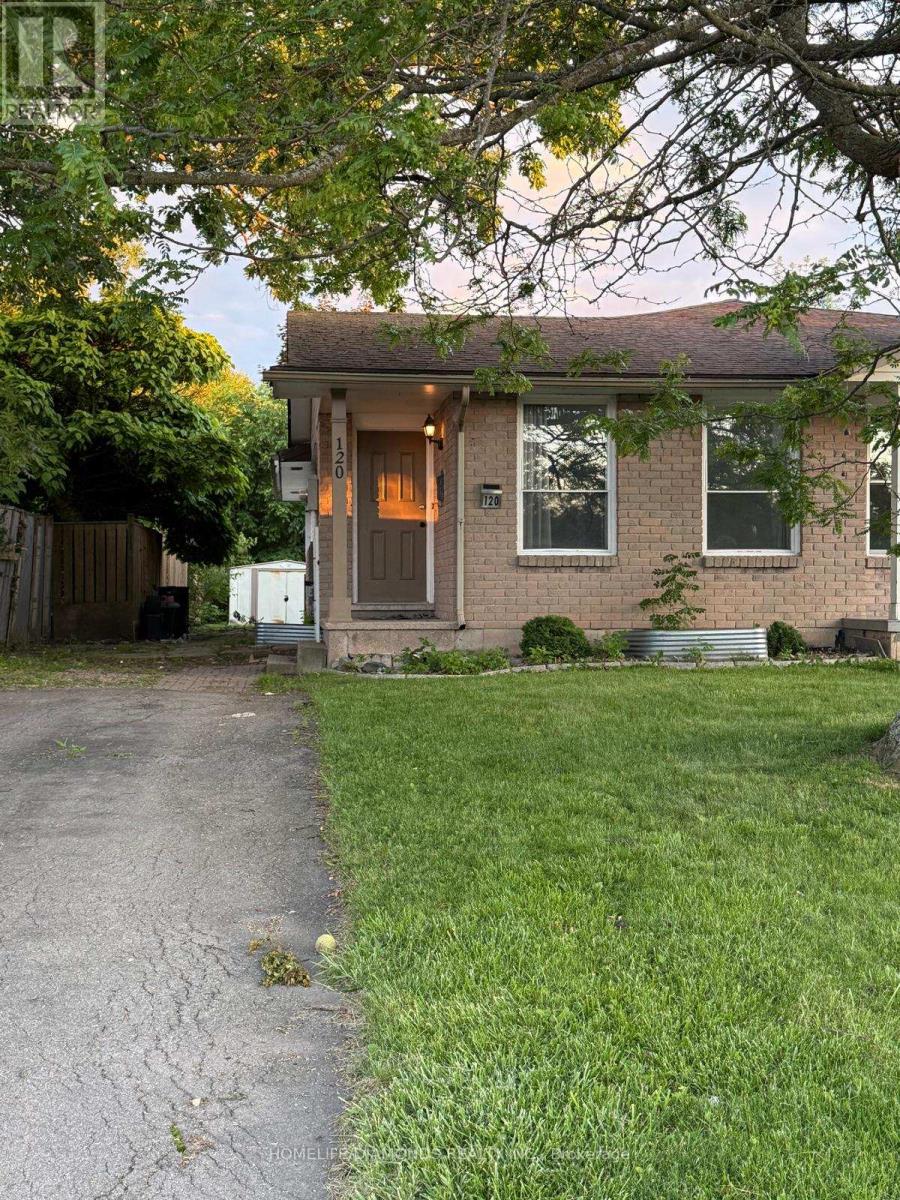 For Rent56 days8
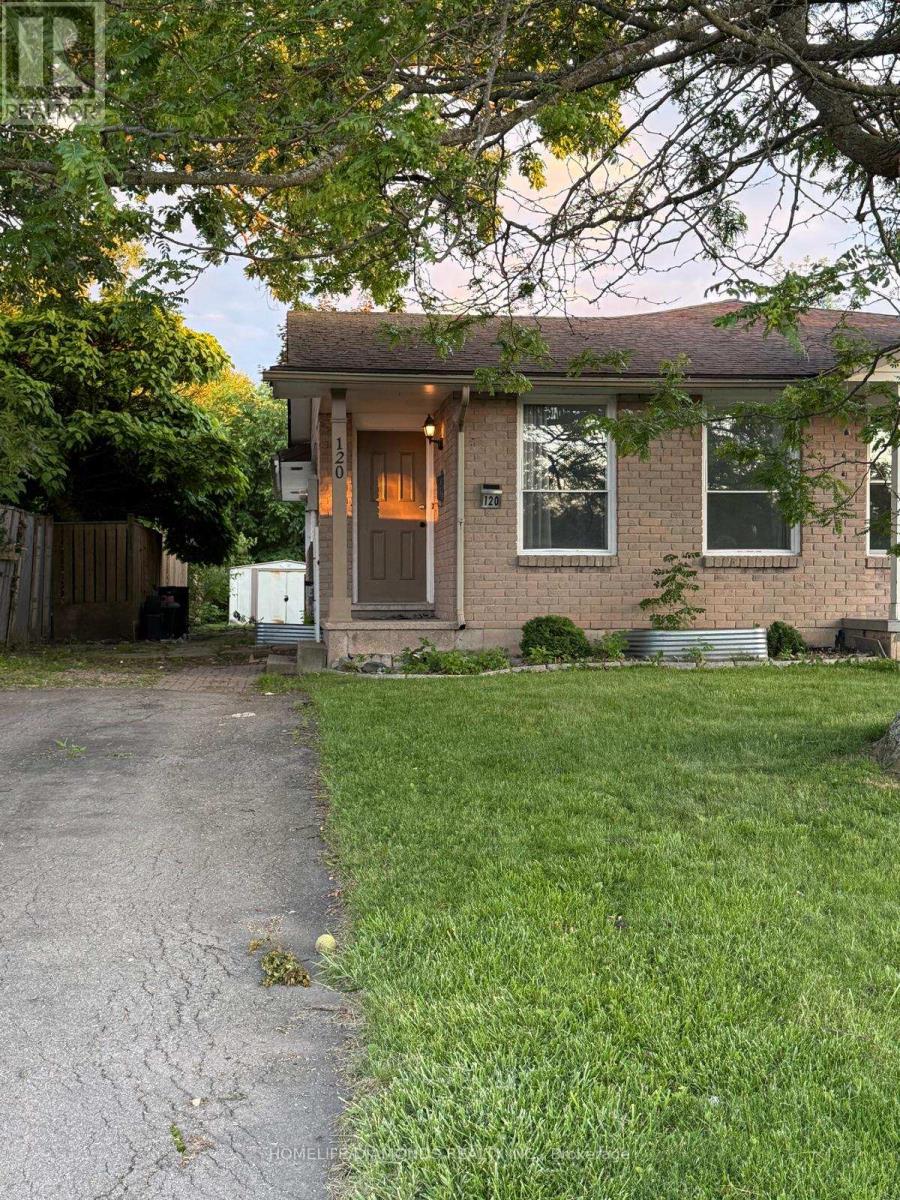 For Rent56 days15
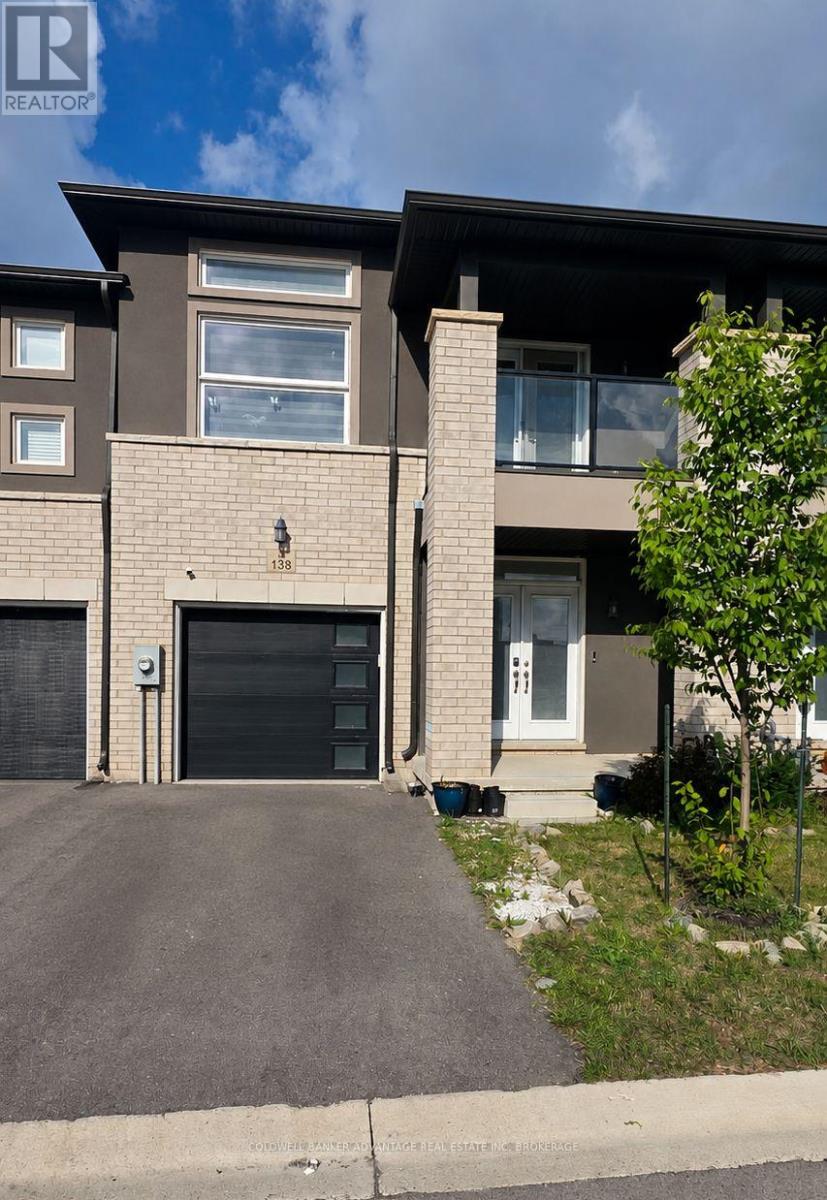 For Rent57 days15
Market stats in 767 - N. Welland
Property types in 767 - N. Welland
About 767 - N. Welland real estate
767 - N. Welland currently has 123 active MLS® listings on GetSetSold.ca, with a median list price of $649,450. The market is dominated by ["house"], and new listings are added daily from the live MLS® feed, so what you see here is always current.
Whether you're buying your first home, upsizing, or looking for an investment property, browsing live 767 - N. Welland listings is the best way to understand what your budget buys right now. Prefer to rent? There are also 19 rental listings available in 767 - N. Welland. For a personalized take on the 767 - N. Welland market — pricing trends, neighbourhood trade-offs, and upcoming listings — talk to a local REALTOR® who works these streets every day.
FAQs about 767 - N. Welland real estate
How many homes are listed in 767 - N. Welland?
There are currently 123 active MLS® listings in 767 - N. Welland, including 104 homes for sale and 19 properties for rent. Listings update daily from the live MLS® feed.
What is the median home price in 767 - N. Welland?
The median list price for homes in 767 - N. Welland is $649,450, based on currently active MLS® listings.
What is the median rent in 767 - N. Welland?
The median asking rent in 767 - N. Welland is currently $1,895 per month, based on active rental listings.
What types of properties are available in 767 - N. Welland?
The 767 - N. Welland market offers 102 ["house"]s, 18 ["row / townhouse"]s, 2 ["other"]s, 1 ["duplex"].
Rohit K Sharma
123 active listings in 767 - N. Welland, Welland with a $649K median — a balanced market where pricing strategy decides who wins. Ask me what your street is doing.
Niagara Region Market
Use our home price trends to better gauge local market conditions and plan your next move. The graphs below show benchmark prices of homes sold in the area. Data generated by MLS® Systems and the MLS® Home Price Index (HPI) — Canada's most advanced tool to gauge local home price levels and trends.
Year over year
Past 10 years
Contact us for more detailed market information.
Source: CREA MLS® Home Price Index · Niagara Region · Updated 2026-09